- International Units: 0.08% BAC (US) = 0.80 g/L (France/Spain) = 0.80‰ Promille (Germany/Nordics) = 80 mg/100 mL (UK).
- Progression of Impairment: 0.02%–0.05% causes subtle tracking loss and mild euphoria; 0.08% impairs braking and steering; 0.15% causes severe motor loss.
- Sex & Body Composition: Variations in body water percentage (men ~68%, women ~55%) mean females reach higher BACs from identical doses.
- Tolerance vs Impairment: Subjective tolerance masks feelings of drunkenness, but physiological reaction lag and collision risk remain unchanged.
What does BAC actually measure?
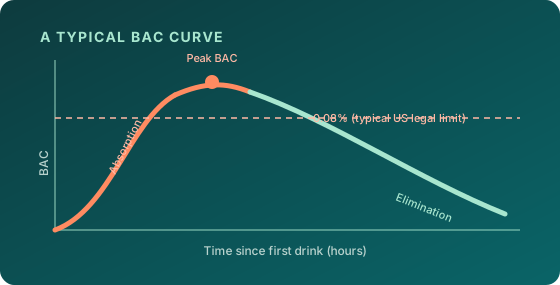
Blood alcohol concentration, usually shortened to BAC, describes the amount of ethanol in a volume of blood. In common US notation, a BAC of 0.08% means 0.08 grams of alcohol per 100 milliliters of blood. It is a concentration, not the percentage of your body made up of alcohol and not a count of drinks.
Reading the unit is essential. The same concentration can be printed as a percentage, grams per deciliter, grams per liter, or milligrams per 100 milliliters. A decimal that looks different may represent exactly the same concentration. The conversions below explain notation; they do not convert a blood result into a breath test result.
BAC levels and possible effects
The following blood alcohol chart summarizes examples from NHTSA's description of BAC and driving effects. Effects overlap and vary. Do not wait for a listed number before taking concerning symptoms seriously.
| BAC | What may be affected | What the number does not establish |
|---|---|---|
| 0.02% | Visual tracking and dividing attention between tasks | A safe level for driving |
| 0.05% | Coordination and response to unexpected events | A universal legal threshold |
| 0.08% | Concentration, speed control, and processing information | A personal target or predictable drink count |
| 0.10% | Keeping a vehicle in its lane and braking appropriately | The point where impairment first begins |
| 0.15% | Balance, muscle control, and multiple driving skills | A reliable boundary below alcohol poisoning |
A person can have a medical emergency without knowing their BAC. A person who appears conversational can still have impaired judgment. Neither appearance nor a calculator can rule out danger.
Percent, g/L, and mg/100 mL: comparing the same value
| BAC percent | g/dL | g/L or per mille | mg/100 mL |
|---|---|---|---|
| 0.02% | 0.02 | 0.2 | 20 |
| 0.05% | 0.05 | 0.5 | 50 |
| 0.08% | 0.08 | 0.8 | 80 |
| 0.10% | 0.10 | 1.0 | 100 |
For blood values in these units, multiply the percentage number by ten to obtain grams per liter. Thus 0.08 becomes 0.8 g/L. Multiply it by 1,000 to obtain milligrams per 100 milliliters: 0.08 becomes 80. Check that the original result is actually a blood concentration before using these relationships. Breath measurements commonly use different units and require their own interpretation.
Why a BAC by weight chart is only an estimate
Weight-and-drinks tables hide several assumptions in a small grid. They normally assume a standard amount of ethanol in every drink, a body-water factor, a drinking period, and an elimination rate. Real drinks and real people do not consistently match those assumptions. Choosing the nearest weight row adds another source of rounding.
Two people of the same weight may have different body compositions and drinking histories. A slow dinner and a short burst of drinking also produce different patterns of absorption. That is why a BAC chart by weight should be used to understand broad relationships, not to certify a current concentration. Our BAC estimation guide explains the assumptions behind an individual calculation.
Count alcohol, not just glasses
A glass is a container, not a standard dose. A large wine pour, strong beer, or mixed drink can contain much more ethanol than the serving a chart assumes. In the US, a standard drink contains 14 grams of pure alcohol, according to NIAAA's standard-drink explanation.
For a simple label comparison, 500 mL of beer at 6% ABV contains 30 mL of ethanol. A 330 mL beer at 4% contains 13.2 mL. The larger, stronger beer therefore contains more than twice as much alcohol even though both are called one beer. The alcohol volume calculator helps compare actual servings before using a BAC estimate.
A BAC chart is a snapshot, not a timeline
Alcohol entering the bloodstream and alcohol being eliminated are different processes. A person who has just finished a drink may still be absorbing alcohol. A time adjustment that simply subtracts a fixed amount each hour cannot fully represent that rising phase.
Consider an evening with drinks at several different times. Knowing only the total number and the time since the last drink leaves out when the earlier drinks were consumed. Remembered serving sizes may be uncertain too. A detailed estimate can illustrate a model, but those missing details remain missing. If timing is your main question, read how alcohol absorption develops alongside this chart.
Legal limits are not a safety scale
Legal thresholds define particular offences; they are not a promise that lower concentrations leave driving unaffected. The CDC explains that impairment starts below common legal limits. Different driver categories and jurisdictions can also have different rules.
Do not mark a BAC chart with a green zone labeled “safe to drive.” That visual shortcut turns an uncertain estimate into a decision it cannot support. Use our legal-limit reference to understand units and jurisdiction differences. If drinking is part of your plans, arrange a sober driver, public transport, a taxi, or a place to stay before the first drink.
Respond to the person, not the chart
Difficulty waking someone, seizures, slow or irregular breathing, and severe confusion after drinking require urgent attention. Call local emergency services and describe what you are seeing. Stay with the person and follow the dispatcher's instructions. Do not assume they can sleep it off or wait for an online result.
NIAAA's alcohol-overdose guidance explains that alcohol concentration can continue rising after drinking stops. A chart cannot diagnose overdose, and the absence of a dramatic-looking estimate cannot rule it out. When helping someone, details about what they drank, other substances, and their symptoms are more useful to responders than a guessed BAC.